A while back I presented this talk at a local PHP Meetup, and not to forget about it, here is the (much) cleaned up version in written format.
 I have recently taken over development and maintenance of vscode-php-debug project. I have worked with PHP for 15 or more years and interactive debugging was always something I wanted, needed, and tried to push others to also use. I like to start with querying the audience. Who here knows what interactive debugging is? Who used it? With PHP? Specifically with VS Code?
 This is me. As the kids say today: “Like and subscribe my channel”. (Disclaimer: I have no channel)
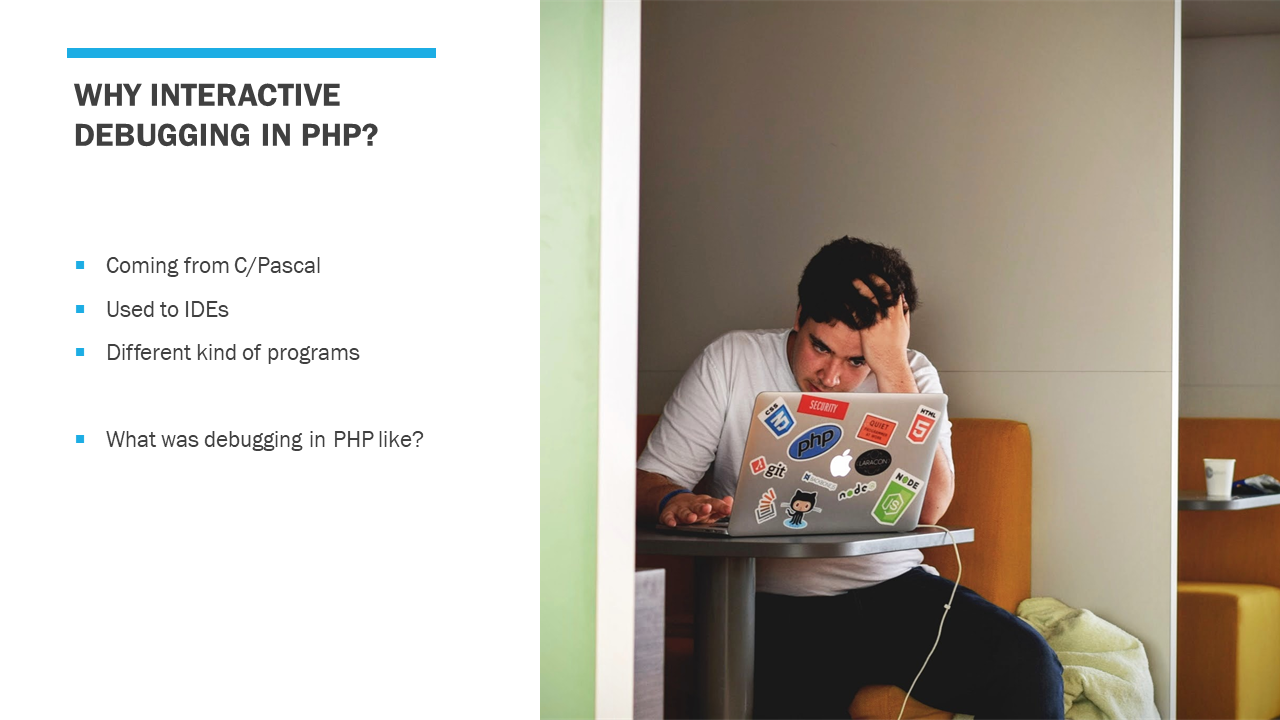 Since I started my programming careerer with environments Pascal, Delphi, Visual Studio, even Linux/GDB, a interactive debugger was always “just there”. Although PHP usually has a different lifecycle - short lived requests, without shared state - I still always wanted the ability to stop the code, follow it, inspect what it was doing. Without and IDE and an interactive debugger this usually looked like this:
 Or if the problem was particularly hard, or bad, like this:
 But it doesn’t have to be like this.
 So to start, as the etiquette demands, a quote from Wikipedia. What is interactive debugging?
A process, also known as step debugging, allows you to interactively walk through your code, inspect data structures and influence each step the program makes. Typical operations during debugging are stepping through the code, inspecting local and global variables, setting breakpoints… To achieve this a separate process, called a “debugger”, is needed that can influence the “target” process, also called a “debugee”.
 In a more traditional sense, for example Linux or Windows native processes, the debugger interacts with the debugee with the help of the OS or kernel.
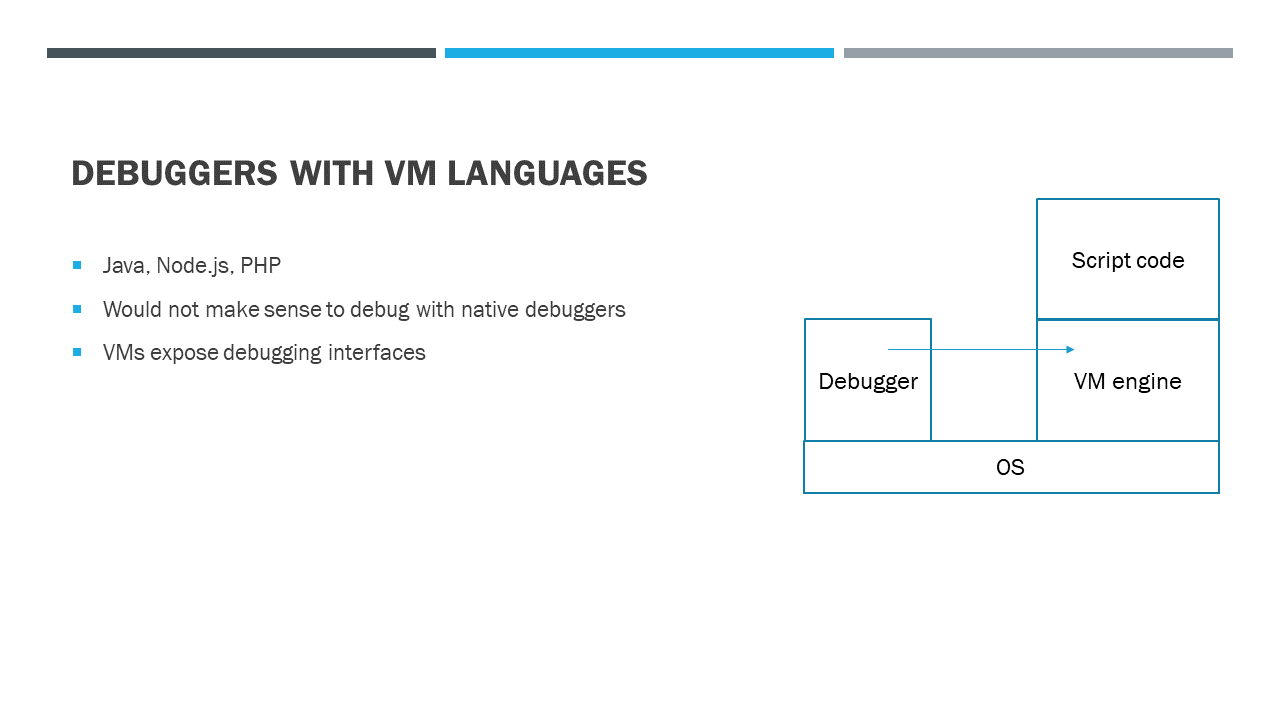 When we have languages like Java, Node.JS or PHP they run inside a Virtual Machine, and debugging these directly via the OS would not make much sense. We would be debugging the language runtime/VM. In these cases, the language runtime expose debugging features themselves.
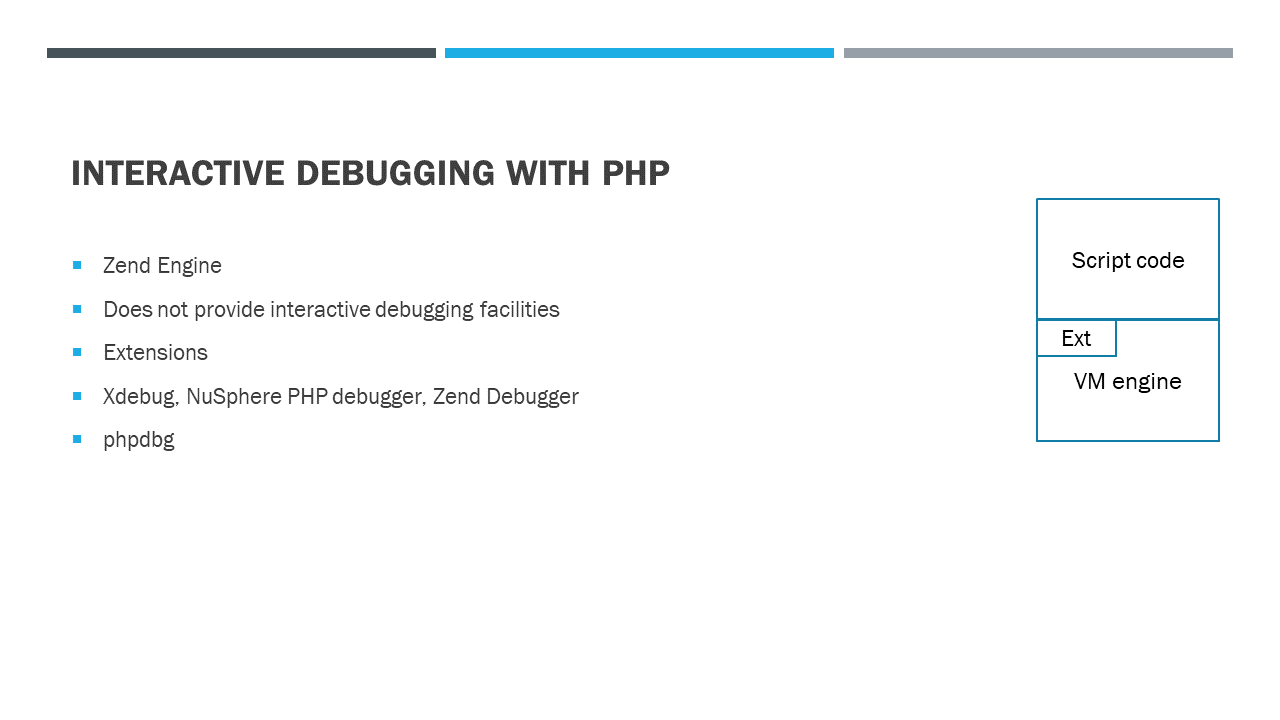 Like with Java or Node.JS in case of PHP the language runtime/VM needs to provide facilities for step debugging. However, the stock PHP installation does not have any such functionality. This was provided via 3rd party extensions like Xdebug created by Derick Rethans. There are also other, most notably Zend Debugger and NuSphere PHP Debugger. There is something called “phpdbg” that comes with PHP however I have not yet extensively researched it. It seems like a GDB like debugger.
 As said, Xdebug is an extension of PHP, more specifically a Zend extension. As you know, the core of the PHP VM is called Zend Engine and only this way can Xdebug hook into places of the VM that allow it to provide debugging functionality.
Xdebug itself does not provide any visual interface for debugging, instead, like Java and Node.JS exposes a debug TCP connection that a client or IDE can use to talk to it.
As said, Xdebug is an extension of PHP, more specifically a Zend extension. As you know, the core of the PHP VM is called Zend Engine and only this way can Xdebug hook into places of the VM that allow it to provide debugging functionality.
Xdebug itself does not provide any visual interface for debugging, instead, like Java and Node.JS exposes a debug TCP connection that a client or IDE can use to talk to it.
 The protocol in use is DBGp and although it was created specifically for Xdebug (between Derick and ActiveState) it is also used with other engines (PERL, Python, TCL, AutoHotkey…).
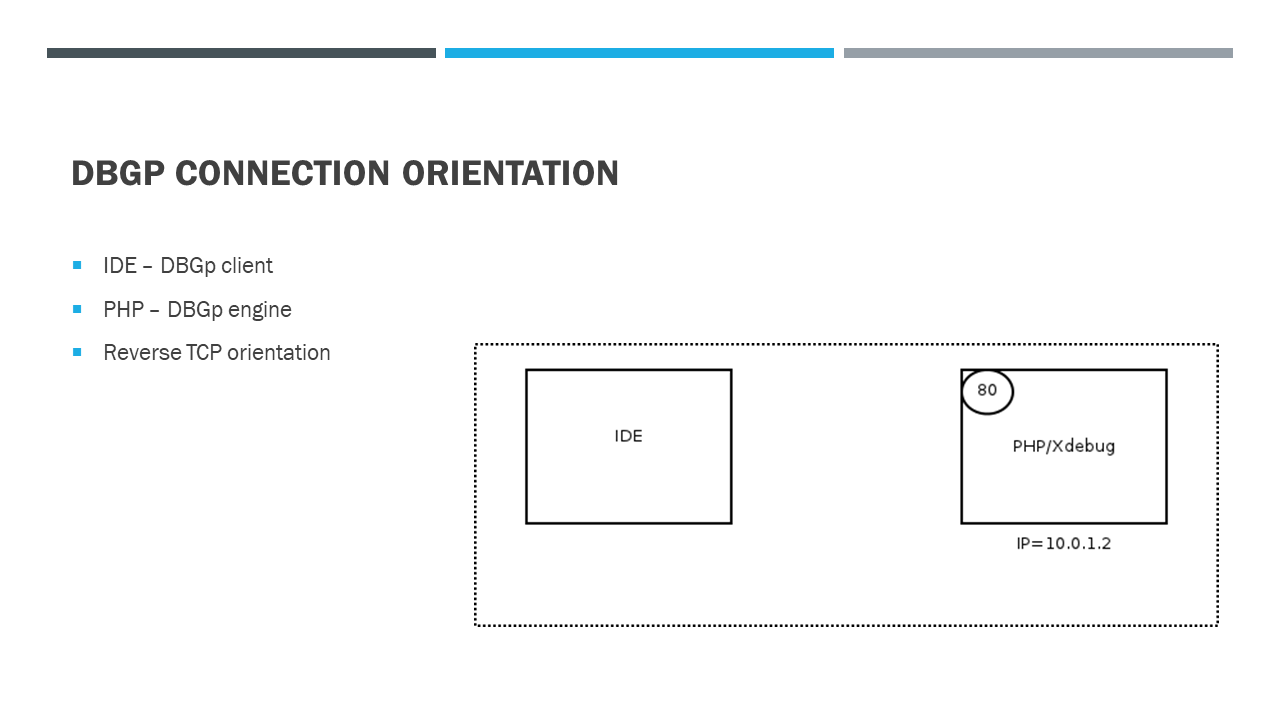 It is a bit different from other systems in that usually the language engine waits for a debugger connecting to it and only then starts code execution, here the engine connects to the IDE.
The terminology also used is, on one side Debugging Engine (PHP/Xdebug / debugee) and DBGp client (IDE / debugger) on the other side. Even though the TCP server is the IDE and the TCP client is the Engine.
 On the wire the protocol is a NULL delimited one-line protocol from IDE to Engine and XML from Engine to IDE.
The most important messages in the protocol are continuation commands (step, continue), breakpoints, feature negotiation, stack, context and property inspection and evaluation.
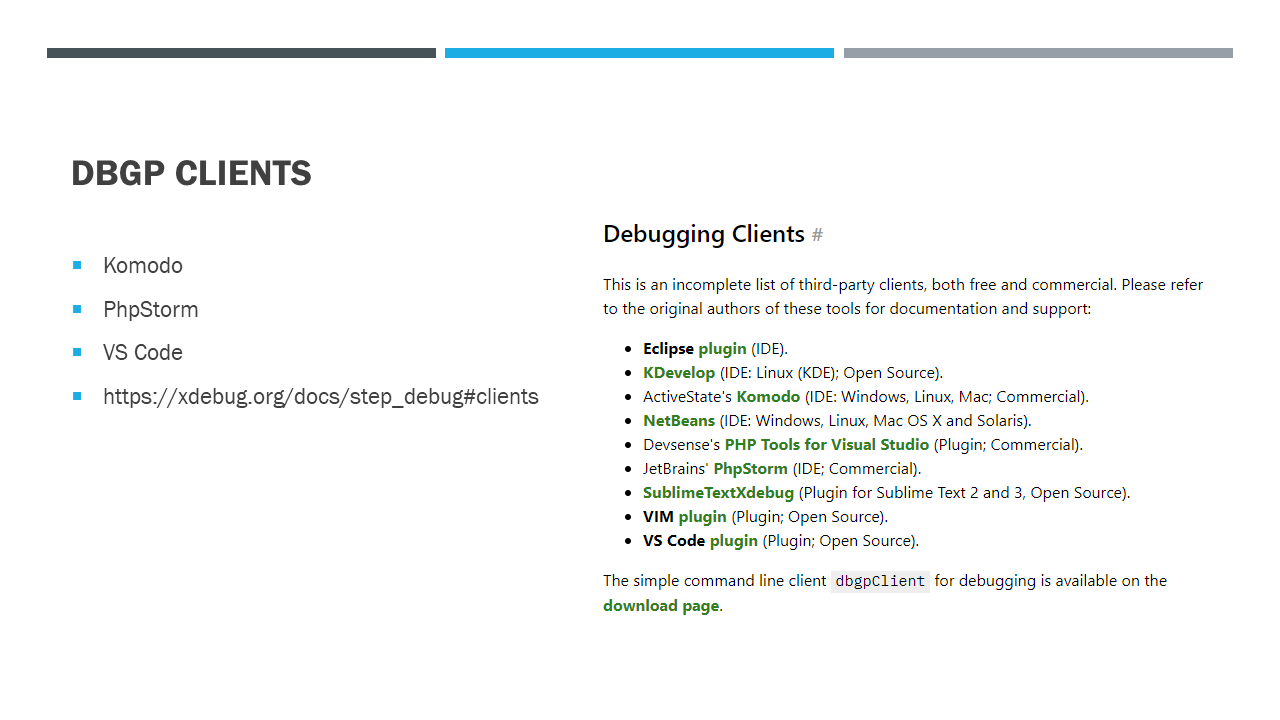 As said, Xdebug itself does not provide a visual interface for debugging. We need a DBGp client for that. On the Xdebug web page there’s a command line client one can use and there’s a list of popular IDEs.
The bigger names would be Komodo, PhpStorm and (the point of this talk) VS Code.
 Now let’s look at this picture from the opposite side. VS Code is an editor or IDE that aims to be highly extensible. It’s approach to debugging is a great example of this.
One can write an extension for VS Code and influence almost any part of its UI. So, to write a debugger one would need to create an icon in the activity bar, implement tree views for properties in the side bar, some interface for breakpoints, an immediate interface, possible configuration interface …
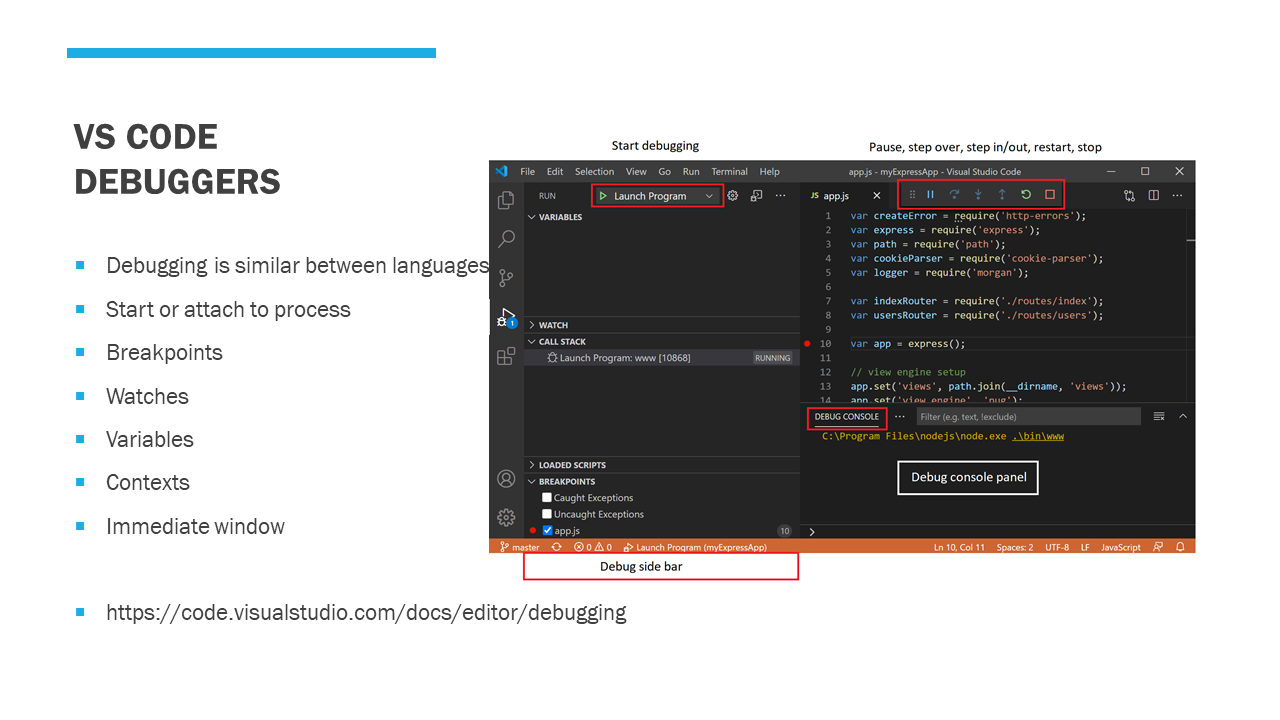 However, typically, the process of debugging, compared between different languages, is very similar.
One starts or attaches to a process being debugged, sets some breakpoints, controls execution flow, inspects some variables and contexts, adds a few watches, and perhaps uses an “immediate” window.
Imagine that every debugger for every language would need to implement all of that!
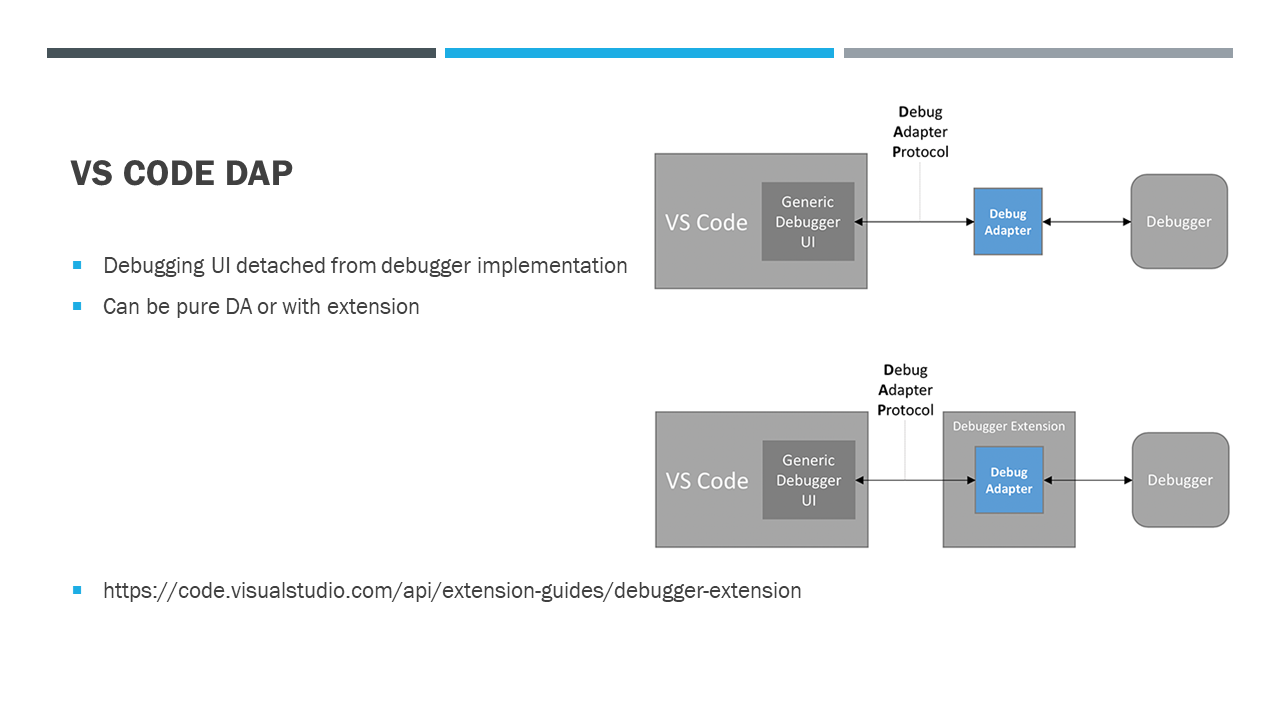 Instead, VS Code offers a generic, language agnostic, debugger UI and an abstract protocol for communication with a debugger backend. Since different debuggers talk different protocols, an intermediary is needed to translate the communication. This is called a Debug Adapter and the wire protocol between the UI and the debug adapter is called Debug Adapter Protocol.
This can be an external process that VS Code talks to over IPC, like a TCP connection or STDIO, or it can be an actual VS Code extension, developed in TypeScript and loaded into the runtime of the IDE.
The topic of this talk, vscode-php-debug, is a Debug Adapter.
 As said, this project is a Debug Adapter, meaning it translates and holds state between VS Code and Xdebug. It implements most of the expected features like various types of breakpoints, conditional breakpoints, hit conditional breakpoints, continuation commands, stack traces variable inspection and the debug console (or immediate window).
 The original author of this project is Felix, but recently he could not continue with support and development, so in coordination with Derick, I took over maintenance and development in beginning of 2021.
 Lets look at how to set things up.
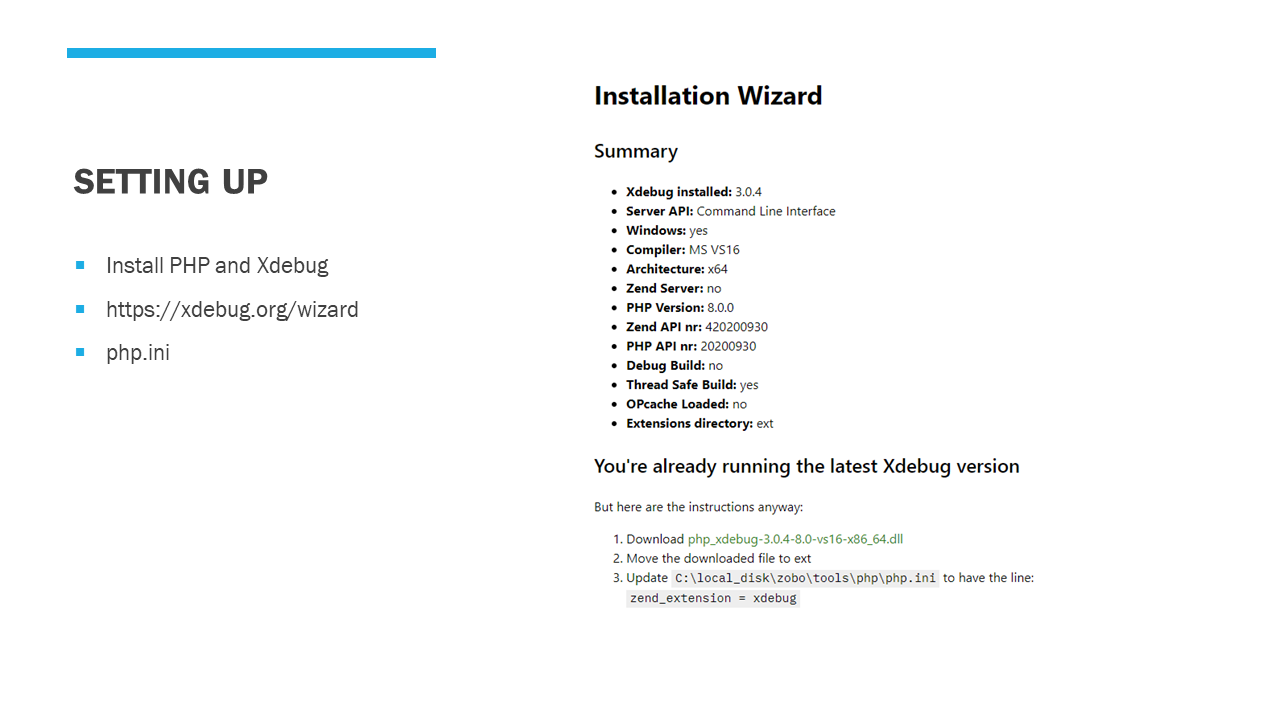
Initially, we need PHP and Xdebug to be installed. If you are on Linux, one option is to use your Distributions PHP and Xdebug, use PECL to compile it, or compile it directly from source. If you are on Windows it’s best to use pre-compiled binaries. PHP can be downloaded from https://windows.php.net and Xdebug DLLs can be downloaded from https://xdebug.org. There is even a tool on https://xdebug.org/wizard that can help you determine what exact file you need to download.
After you have your extension in place, you need to load it into PHP via php.ini.
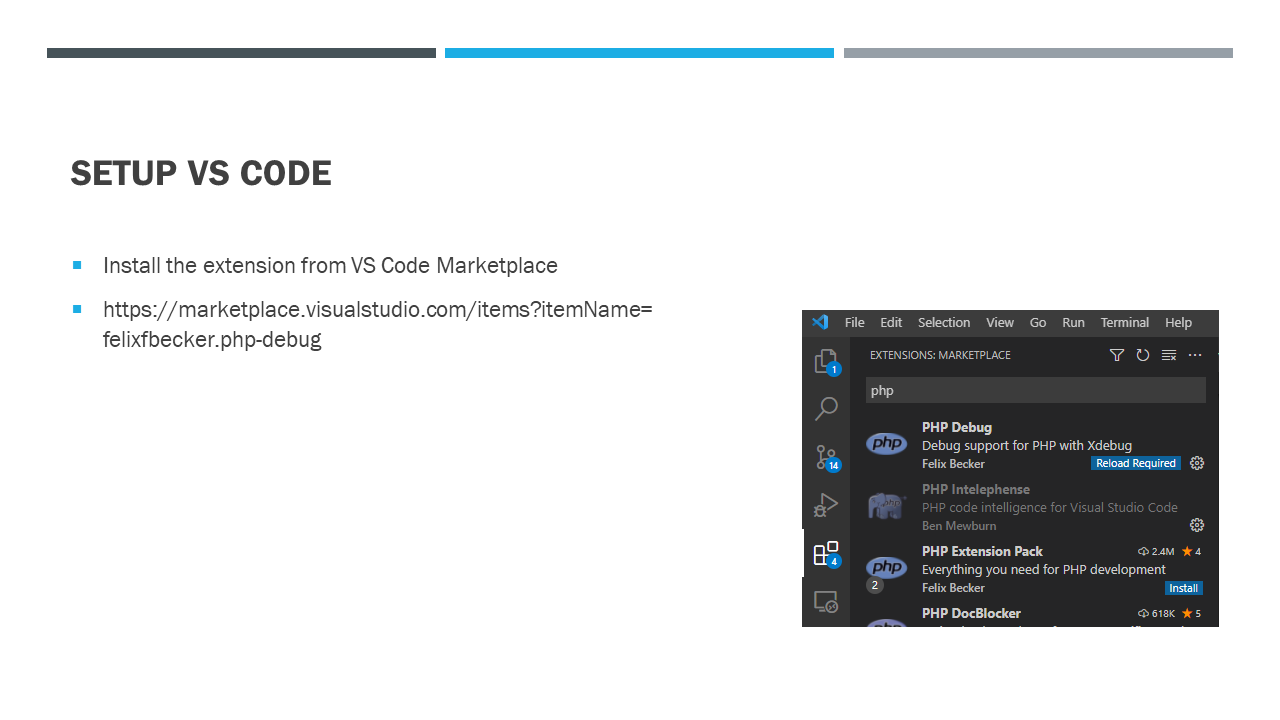 Next step is to install the VS Code extension. VS Code will also offer to install this extension when PHP files are open.
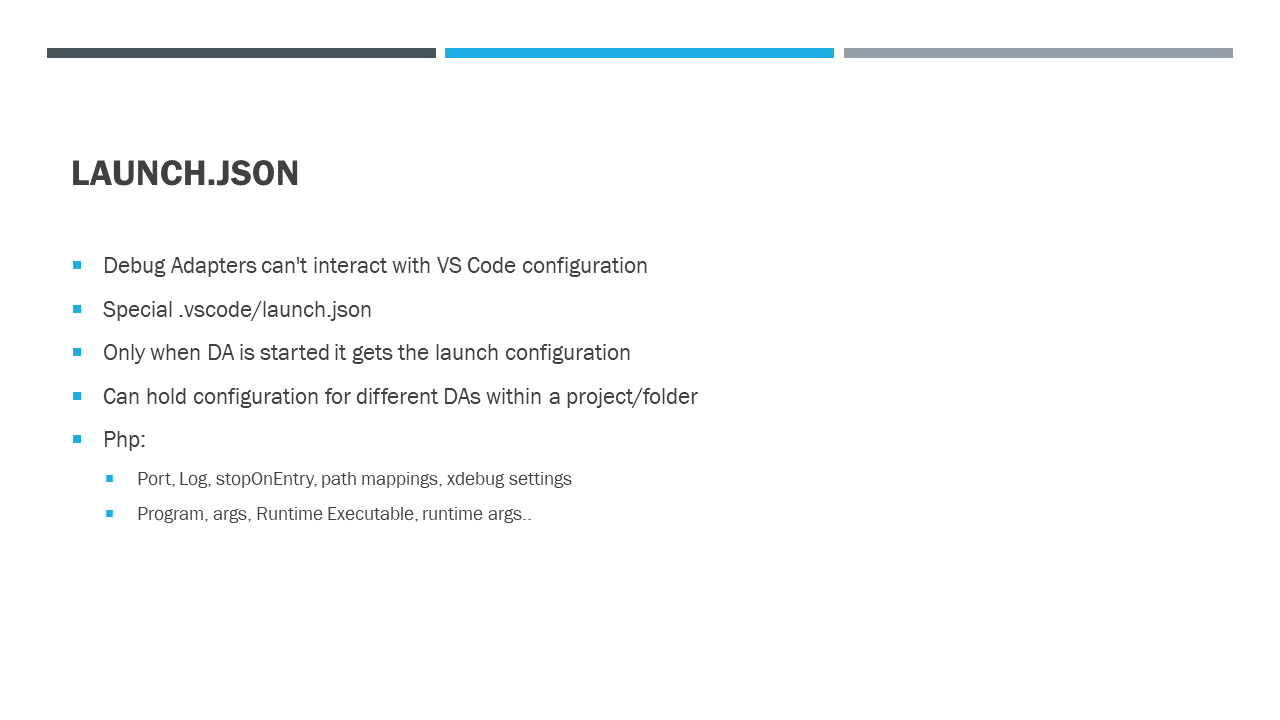
Typically, and especially so pure debug adapters, don’t interact with VS Codes directly, meaning they can’t access any of the settings defined there. They get all their configuration when they are started, from a special .vscode/launch.json file in the project folder.
The file can hold multiple “debug configurations” that define what debug adapter will be used, and what its launch or attach parameters will be.
This means inside a project folder, one can simultaneously debug a Node.JS process, Chrome application and PHP.
In our case, we can define configuration directives like port, stopOnEntry, log, ignore, pathMappings and xdebugSettings. Also, program, args, runtimeExecutable, runtimeArgs, cwd an env.
–
 To make things more developer friendly, when launch.json is initially created it is populated with some defaults, shipped with the extension. In this case these defaults are:
- Listen for Xdebug
- Launch currently open script
- Launch Built-in web server
Each tries to pass specific command line arguments to PHP to make debugging work without effort.
There are also other configuration snippets, as they are called by VS Code, that are specific for the obsolete Xdebug 2. I should mention here that there was a big INI configuration change between Xdebug 2 and 3, that causes confusion. Even the default connection port was changed from 9000 to 9003.
 Speaking of ports. Remember we said Xdebug connects to the IDE. So, this DA must listen for incoming connections. When we tell VS Code to “start” debugging a TCP server is created and it waits for incoming DBGp connections.
If the launch.json configuration also defines to start a PHP process, that happens after the server was prepared.
When a PHP script is executed and Xdebug connects to our TCP server, all the needed DBGp negotiations are done (init packet, features, breakpoints, run) and when a breakpoint or other stop condition is hit DA tells VS Code to present the code execution place, variables, stack etc.
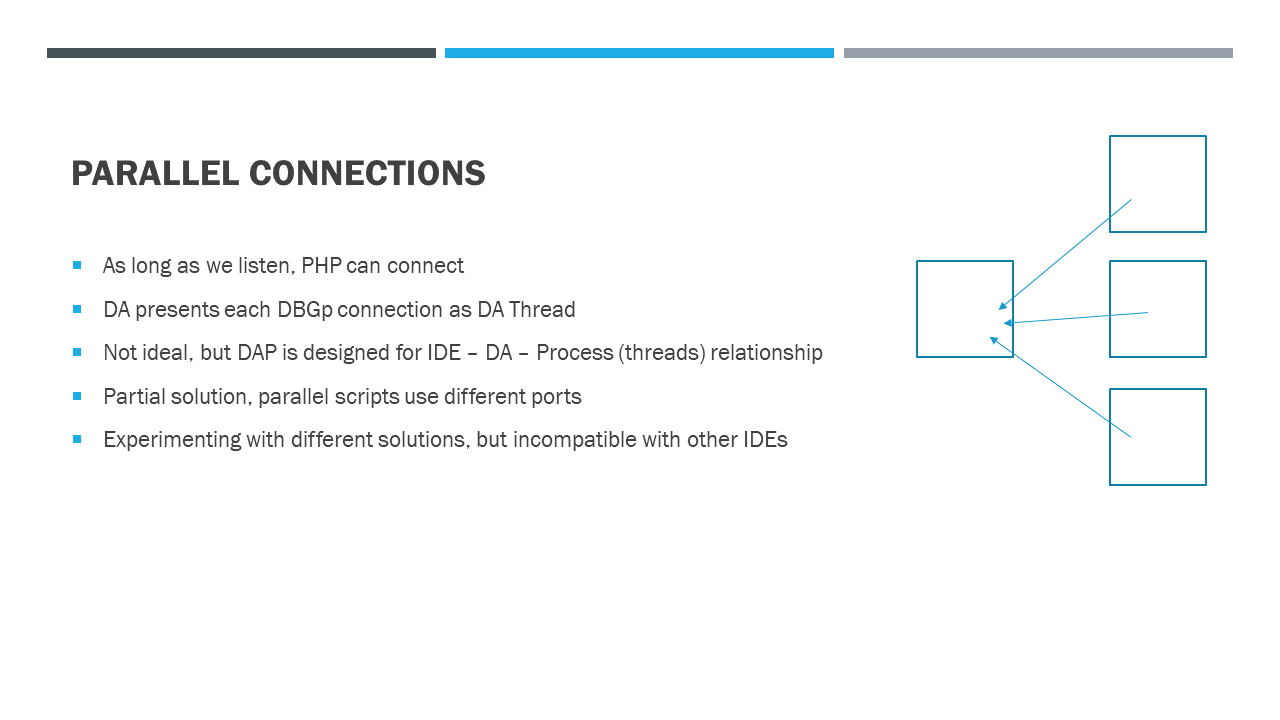 Since we listen on a TCP port, we don’t have much control over what connects to us. If multiple scripts or web requests get triggered while we listen, we get more than one DBGp connections. This is currently handled in the Debug Adapter by presenting each connection as a Thread to VS Code. Internally the DA must track each connection separately and also coordinate state changes like breakpoints between them.
This is not ideal since the Debug Adapter design was intended to have an IDE – DA – Process relationship, not multiple Processes.
One way we mitigate this, in case where scripts are launched by DA, is that we assign a random debug port to each DA – Process pair.
I am experimenting with another solution where we integrate more tightly with VS Code and ask it to spawn new Debug Sessions for each connection. This works OK but is not compatible with other IDEs then anymore.
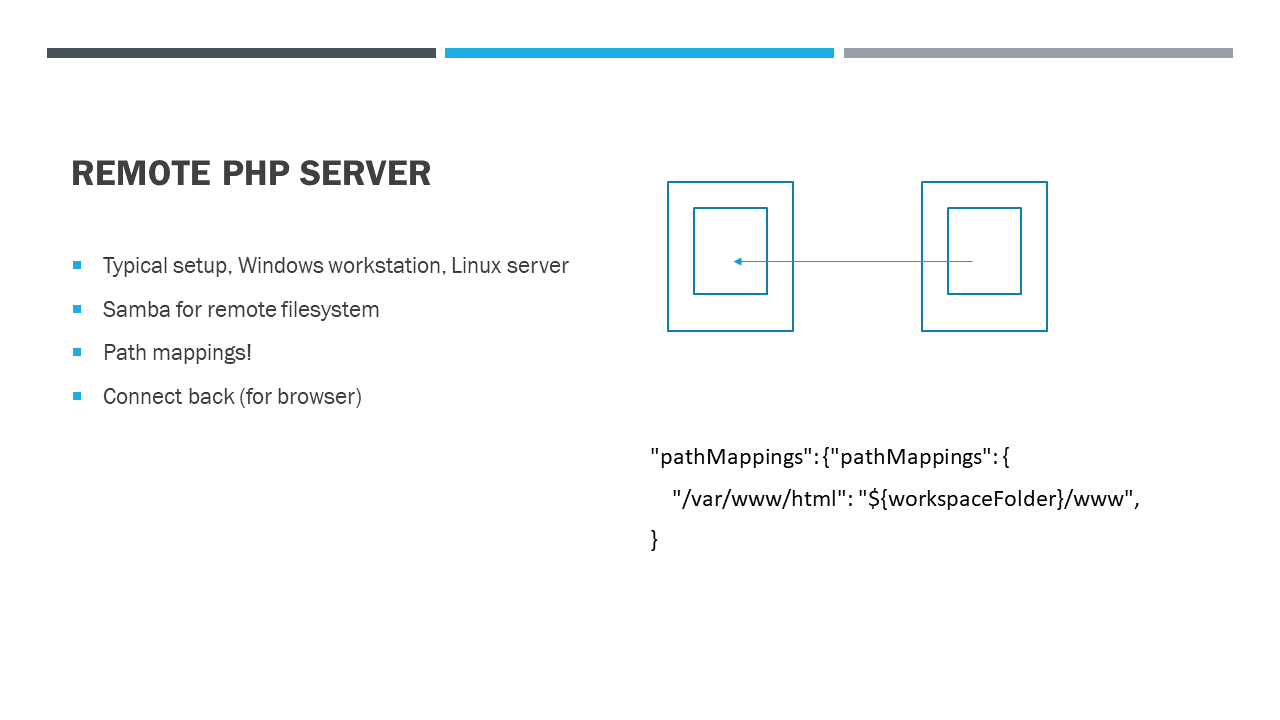 However, more often than not, people run the PHP process on a different computer than they sit behind. A typical setup being Windows workstation and a Linux server. Be it a local VM or a cloud server somewhere.
If that PHP process connects to our IDE, and tells it about its local files, the IDE will not know what to do with them.
In such a scenario, typically, SMB is used for the Workstation to remotely access the Linux server filesystem. And for the IDE to find those remote files, we need to configure path mappings in launch.json. Usually that would map some (server) local path to a remote folder, usually the workspace.
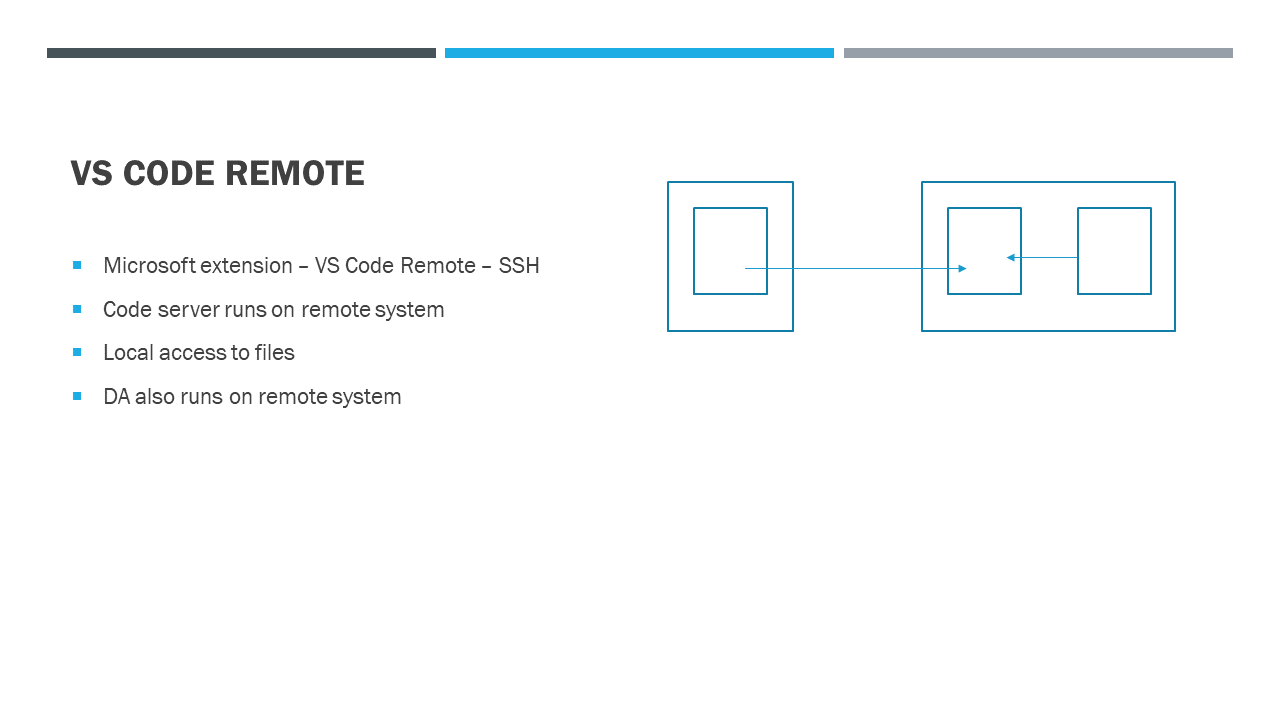 Using Samba to edit and read remote file is OK, but can lead to all sort of problems. A far better alternative s VS Code Remote. This is a special extension from Microsoft where the IDE is split up in two parts.
The UI part runs on your workstation and a “server” part runs somewhere remote. In our case over SSH on the same server where PHP is.
The vscode-php-debug extension also runs on the server side, so the TCP Listen happens there, and all the files are local! This eliminates the need for mappings.
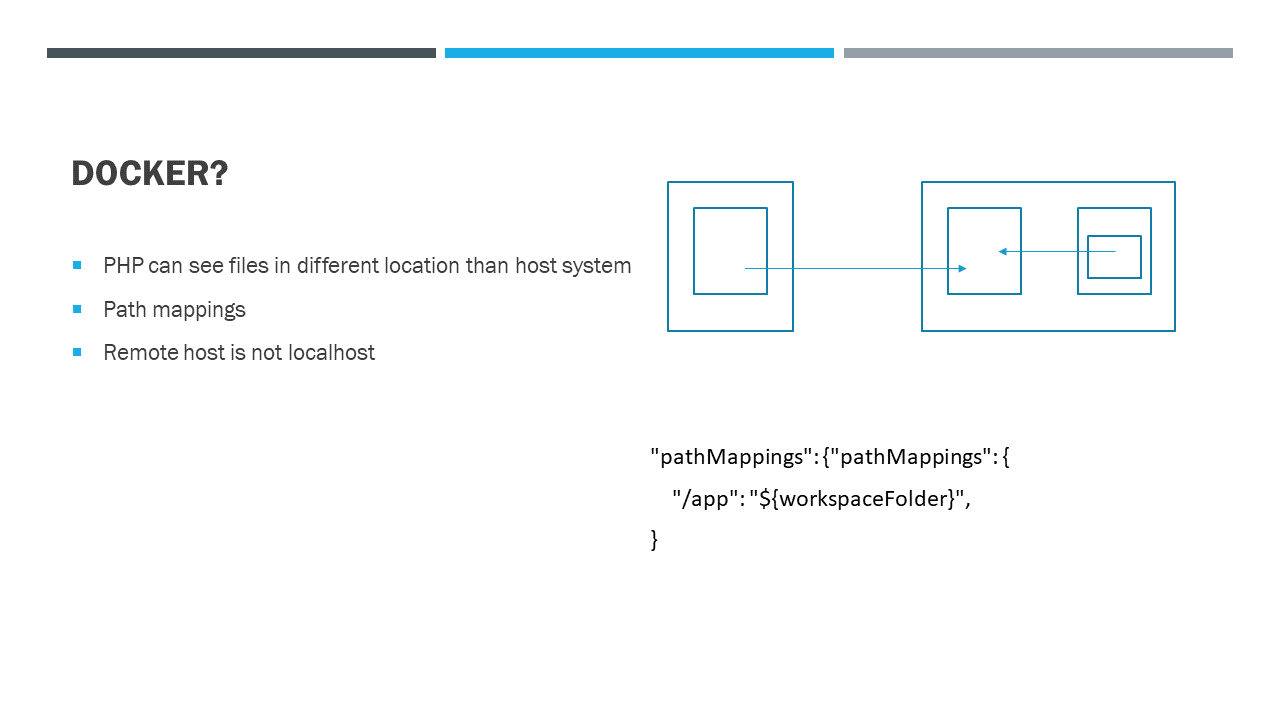 Since we do all sorts of crazy stuff today, lets throw Docker into the mix.
PHP runs inside a Docker on the server. We use VS Code Remote to run the VS Code remote server on the server too. Depending on how the docke-ized PHP sees the files, if they happen to be mapped from the local filesystem, dictates what our path mappings must be. So It could be “/app” -> “${workspaceFolder}”…
This only shows that one has to understand pretty well what’s going on to configure the launch configurations correctly.
 In complex setups where more people are working together on same resources, like the same webserver, sharing the same files, a DBGP Proxy is required. This way each IDE can listen on their own port, register on the Proxy with their IDE KEY so there are no conflicts.
From experience, more people prefer setting up their own environments.
DBGP Proxy is not yet supported, but will be soon.
 The project is developed in TypeScript, but since it is a pure DA implementation, it would not need to be. However since TypeScript is the native language of VS Code, a lot of base classes and helpers exist that make this a better experience.
The most important part is the packages.json, that defines how the extension will interact with VS Code. The documentation about contributions points lists all possible ways an extension can extend or hook into VS Code.
VS Code itself is used for extension development because it has good debugging support for it. A special debug type is available, that runs a secondary instance of VS Code as an Extension host. The extension being developed can be debugged this way.
 The release process is done on GitHub. A GitHub Actions pipeline is set up that checks and runs tests on every pull request. “semantic-release” is used to keep things uniform. Changelog I manage by hand.
Although the automation is great, I would like to be able to push releases out in batched manner.
I tried to create a top-level pull request and merge all others in there, but GitHub didn’t properly close up referenced Issues.
Another option is using the [skip ci] magic tag.
 I try to answer all questions that come to GitHub issues, no matter how banal. There are also a lot of questions on StackOverflow, but I have not yet taken those on.
Top questions are related to path mapping. If I could get that right it would be great.
I ask each reporter to generate a log file of the problem. I have extended the log option in launch.json so that it records not just the DAP messages but also Xdebug messages inline. This works far better than before, where we had to rely on people sending use a separate xdebug.log file where we could not then reliably correlate both.
When I got the project there was years of neglect in the PRs and issues. It’s slowly getting better.
 Open source can take a lot of your time, especially at the beginning when you learn the codebase. You could get unlucky and have people treat you like it’s something you are paid for, however I have very positive experiences so far.
I do have a GitHub sponsors account and a few donations to it.
However, there is another aspect of this work, or perhaps I should call it hobby.
This extension has over 5 million installs! I get to have one on one sessions with Derick about ideas and needs for Xdebug and the debugger. And a few weeks ago, the VS Code Product Manager from Microsoft invites me on a call to discuss development direction of the extension.
But in the end, the best part is somebody walking up to you saying: “I use this a lot and it saves me time and effort!”
 Short term plans include whatever needed support for PHP 8.1, DBGP Proxy and improvements in usability especially related to VS Code. One of them being support for no-folder debugging.