This is a small writeup on the May 2021 release of VSCode PHP Debug adapter extension. A cover issue describing all work can be found on GitHub issues.
Switch to Xdebug 3 port
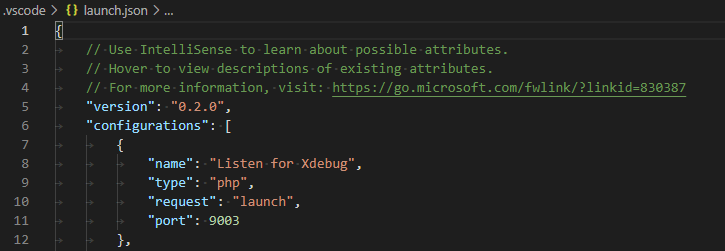
Since Xdebug 2 has been deprecated for a while now, this plugin has switched to default port 9003 - from previous, 9000. The change in Xdebug was introduced by Derick due to often conflicting default PHP-FCGI port also being 9000.
Now when a new launch.json file is created, the default listen port will be 9003.
Auto local port
This feature allows the user to explicitly set port parameter to 0 and this instruct the operating system to allocate a random TCP port to listen on. There are two reasons for this feature/change.
First this is a stepping-stone for implementing DBGp Proxy support. In that case you should use a random local port because more than one user can be working on one system and the well-defined port 9003 is already used by the proxy.
Second this gives a nice way to completely separate debugging of Launch currently open script. Let me explain.
Xdebug/DBGp debugging works so that the debugging engine (PHP+Xdebug) connect back to the IDE (VSCode and this extension). This means that the IDE must LISTEN on a TCP port and the engine connect to that port. This extension must implement Microsoft Debug Adapter Protocol and the way things are designed different debugging sessions cannot interact with each other.
When launching a script for debugging the DAP instance creates a process, tacks is and at the same time creates a DBGp listener and waits for the Engine to connect. What if you want to debug two scripts in parallel?
- You can start the Listen for Xdebug configuration and run both scripts from command line, but the adapter cannot track their execution and display output. That might be ok for a lot of cases.
- If you try to start two of them in the IDE, you will get a PORT IN USE error for the second, because the first debug session is already listening for connections. You can create a different debug configuration and specify a different
port. And then also ask the second php script to connect to that different port. So, possible, but a hassle.
The solution for this is to allocate a random port and pass the port configuration to the script.
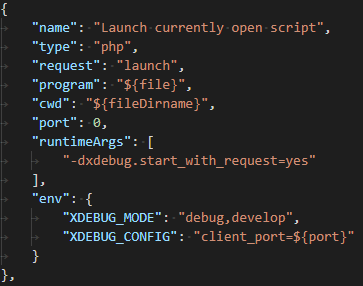
What happens here is that using the environment variables we configure Xdebug to start the debugging process right away and with correct port. See Xdebug docs. So the only thing that needs to be taken care of is to make sure that Xdebug extension is loaded into PHP. Even that could be solved with runtimeArgs if we made sure that the downloaded xdebug.so is in the right place.
Of course, all these defaults can be changed.
Built-in webserver start configuration
The third configuration change is the PHP built-in web server. There is a generic launch.json attribute serverReadyAction. It is used for this specific situation, where you run a program that exposes a web server and the IDE detects the host/port combination and opens a web browser.
You could already use the launch configuration to start the Built-in server, but as a requirement you needed to pass a router script. This limitation was removed and an example configuration is now provided.

Here the DBGp port is fixed (9003) and the web server port is randomized. This can easily be changed to, for example: "localhost:8080". The same way a randomized DBGp port could be used by setting "port": 0 and adding env "XDEBUG_CONFIG": "client_port=${port}".
In fact, if you cluck Add Configuration... and select Launch Built-in web server the IDE will guide you through placeholders.
More on launch.json attributes can be found in the official documentation.
Launch configuration for Xdebug 2
For legacy support, some Xdebug 2 specific snippets were also provided. They do not appear by default in a newly created launch.json but can be added later by clicking the Add Configuration... button.
Bug fixes
A bug in how virtual files were handled was fixed.
Support for extended properties was added and turned on by default. This causes all variable names to be decoded in UTF-8. Altho this is not necessarily correct for all scenarios it does cover a lot of them.
Default Exception filters
The default exception filers are now turned off by default. This was done to mimic other PHP IDEs.

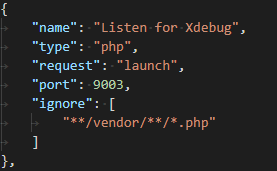
There is currently no real support in VSCode to flexibly control Exception breakpoints. Ideally one could have a way to specifically define what Exception class to break on and wat to ignore. Currently the best thing one can do is use the ignore attribute.
Logging
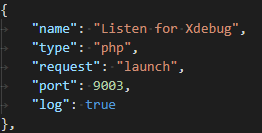
I currently ask users that open bug reports to provide a xdebug.log output. This shows what DBGp commands were exchanged between Xdebug and this extension. This proved to be problematic in a lot of cases. This is why I decided to included all received DBGp protocol data in the log output. Just add "log": true to your configuration and you should see a lot of protocol data.
Conclusion
Although not a lot of visible changes in this release, we are one step closer to a more current debug experience while also preparing the field for bigger changes coming ahead. As always drop me a GitHub issue if there’s something broken or if you can’t seem to get debugging to work.