One of my projects the last few months was getting our own PHP framework to send data to Elastic APM for performance logging and debugging. We decide on Elastic APM since we already started using it for our Golang services and wanted a more complete picture.
There will be another post on why and how we implemented this, I just wanted to share one of the horror stories that happened in the last days.
I just did some refactoring of the APM Agent code and we decided to tune down on the places were errors get automatically logged (database errors) to focus more on other areas of the application. Because of it we missed a nasty bug, so we decided to enable automatic logging of database errors again. However, after a few days there were still no errors in the Kibana APM interface. This is where the horror starts.
We have tests, that produce errors, there were none to be found in the APM interface. However spans and transactions were there. What gives? We even tried to search for them in the Discover section. No results. One would think there’s something wrong with Elastic indexes for Errors? This led me down a rabbit hole of strange warnings and outputs od the ELK docker container, upgrades, downgrades, Java memory flag tweaks and so on. Still no errors from our PHP agent.
Then we noticed that the official Elastic APM Go Agent on the other hand does send Error events to APM and they do appear in the interface… This led to good old tcpdump-ing of network traffic between the APM server and Elastic. There we saw that entries actually to get written to the index and we also see the _id. Ok, we can use that to search in the Discover tool. But, bo results!
Ok, how about directly talking to Elastic? Maybe the frontend is just out of its mind…
$ curl http://elk:9200/apm-7.6.0-error-000022/_search?q=_id:HSSGoXEB1rWFf60w0QI3
{"took":5,"timed_out":false,"_shards":{"total":1,"successful":1,"skipped":0,"failed":0},"hits":{"total":{"value":1,"relation":"eq"},"max_score":1.0,"hits":[{"_index":"apm-7.6.0-error-000022","_type":"_doc","_id":"HSSGoXEB1rWFf60w0QI3",...
Waaait. There’s a result? How?
Then it occurred to me, that Kibana usually limits the time dimension. Behold:
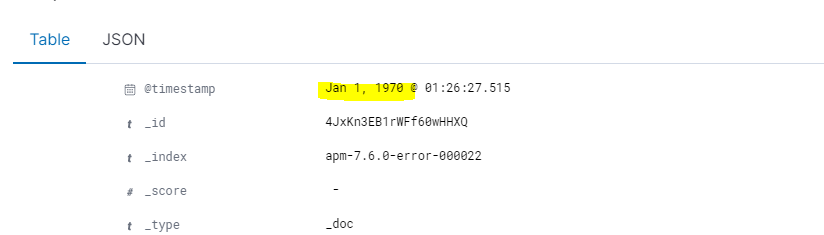
The fix, was obvious.
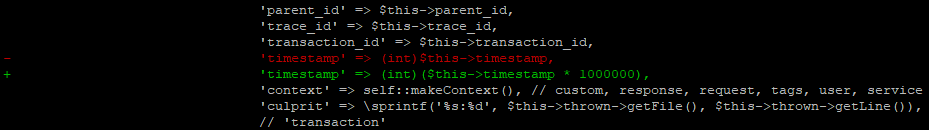
The end.